Rachel Hill-Tsarpelas

Data Analyst | Linguistics
Look what one hour of Excel can do!
This simple placeholder project takes a raw dataset, cleans it, builds pivot tables, graphs, and KPIs, and wraps it all into a compact dashboard. Nothing fancy. Just the basics.
Bike Sales Dashboard Project Highlights
- Pivot Tables: segment customer data dynamically
- Dashboards: consolidate tables and charts for quick insight
- KPIs: summarize key metrics to support business decisions
The analysis focused on questions such as:
- Which income groups are more likely to purchase a bike?
- Does commute distance affect purchasing behavior?
- Are specific age groups stronger target segments?
- How do demographic factors shape buying patterns?
Through segmentation and KPI analysis, the dashboard highlights patterns in customer behavior and demonstrates how Excel can be used as a practical business intelligence tool.
Screenshots
-
Dashboard Overview
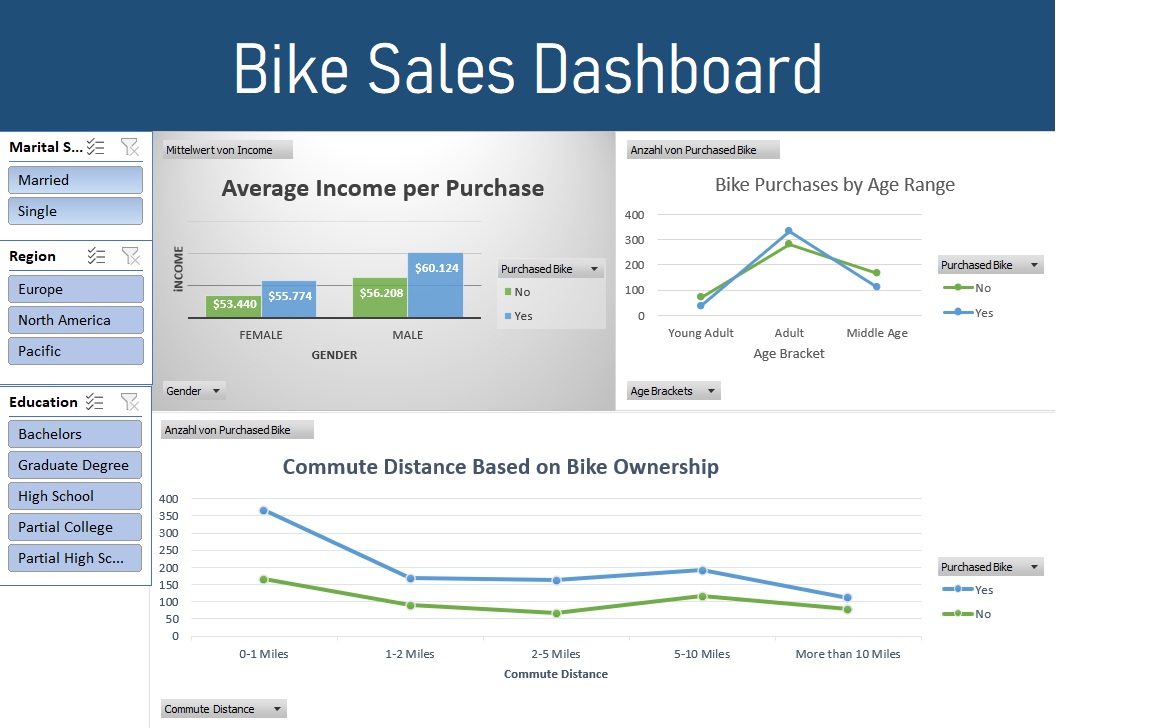 Dashboard Overview – Bike Sales Analysis
 -
Pivot Tables
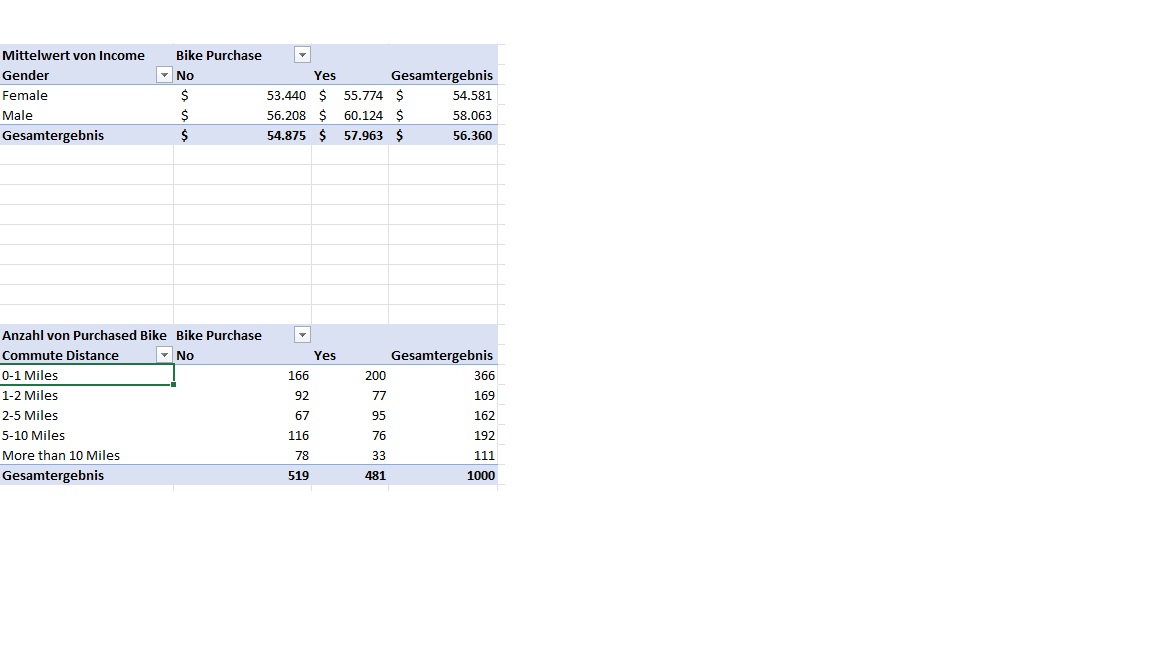 Example of pivot-based aggregation used to calculate KPIs.
 -
Income vs Purchase Analysis
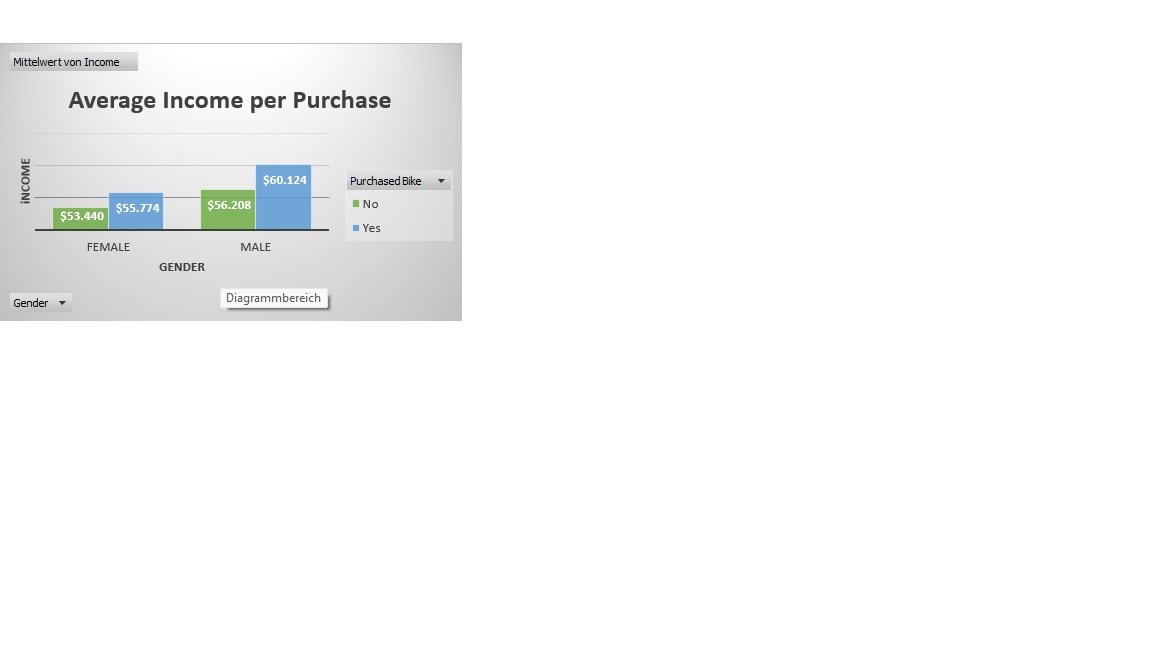
Income segmentation shows stronger purchase behavior in mid-to-higher income brackets. -
Age vs Purchase Analysis
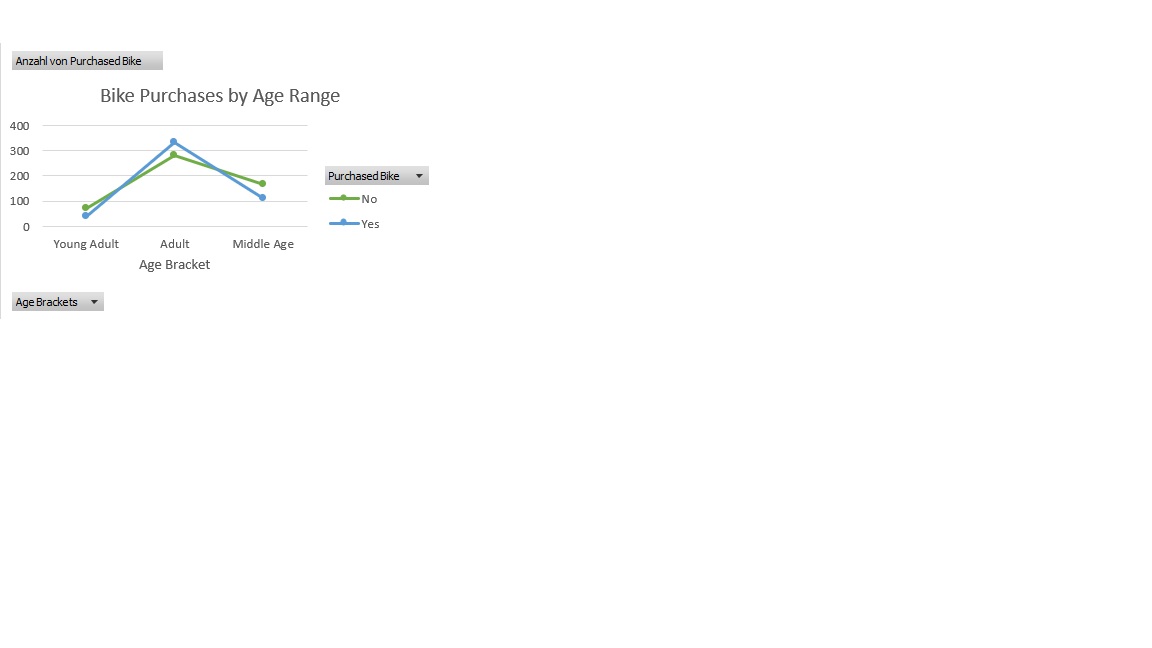 Age distirbution in bike purchases
 -
Formulas / Calculations
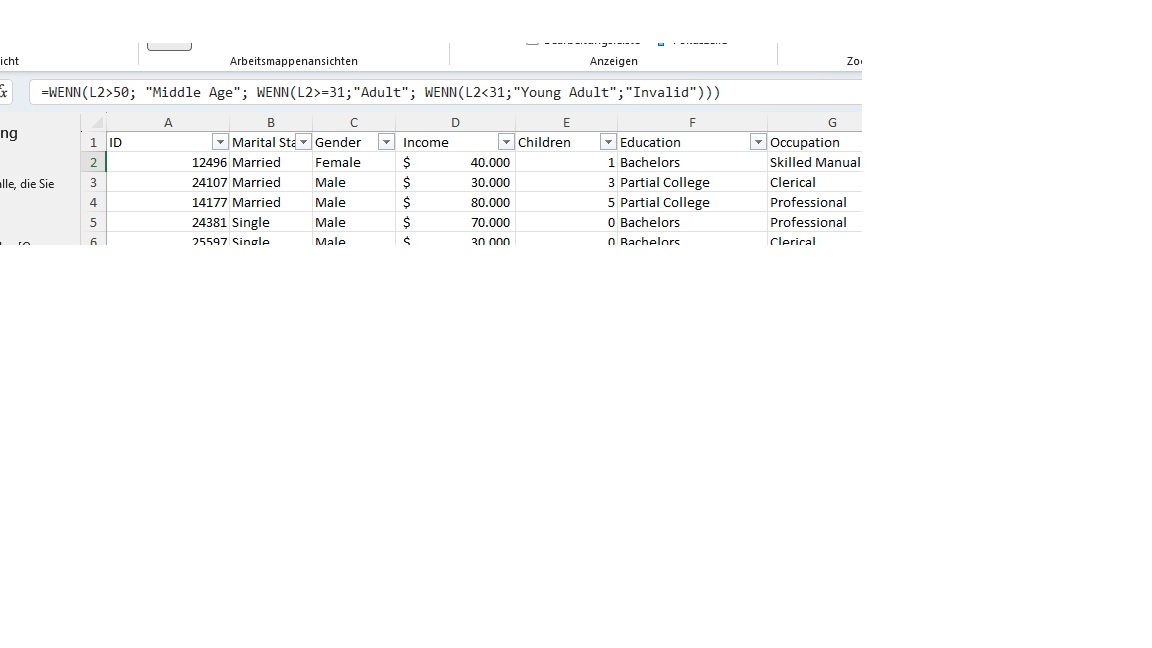 Age groups were created using conditional logic in Excel to segment customers into analytical brackets (e.g., 18–30, 31–50, 51+).


Dashboard Interactivity
The dashboard includes interactive filters (region, maritial status, or education) that let viewers explore patterns dynamically. Using these filters shows how flexible Excel dashboards can adapt to different business questions, highlighting trends even in simple data sets. For instance, in this set, the Europe and North America regions do differ quite noticeably from each other.
Next Steps / Ongoing Work
SQL-basierte Aufbereitung logistischer Open-Data-Bestände und Excel-gestütztes KPI-Reporting zur Analyse von Durchlaufzeiten, Liefertreue und operativen Engpässen. Currently in progress – updates to come.
Dataset
Excel File from Alex the Analyst AlexTheAnalyst on Github
Notes
- Notebooks available in GitHub project repository